

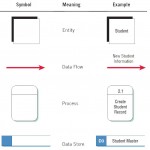
The systems analyst needs to make use of the conceptual freedom afforded by data flow diagrams, which graphically characterize data processes and flows in a business system. In their original state, data flow diagrams depict the broadest possible … [Read more...] about Using Data Flow Diagrams (DFDs)
Using Data Flow Diagrams
Data Flow Approach to Human Requirements Determination
When systems analysts attempt to understand the information requirements of users, they must be able to conceptualize how data move through the organization, the processes or transformation that the data undergo, and what the outputs are. Although … [Read more...] about Data Flow Approach to Human Requirements Determination
Developing Data Flow Diagrams (DFDs)
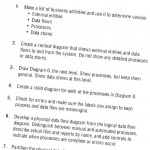
Data flow diagrams can and should be drawn systematically. Table illustrated below summarizes the steps involved in successfully completing data flow diagrams. First, the systems analyst needs to conceptualize data flows from a top-down … [Read more...] about Developing Data Flow Diagrams (DFDs)
Checking the Data Flow Diagrams for Errors
Several common errors made when drawing data flow diagrams are as follows:Forgetting to include a data flow or pointing an arrow in the wrong direction. An example is a drawn process showing all its data flow as either input or output. Each … [Read more...] about Checking the Data Flow Diagrams for Errors
Logical and Physical Data Flow Diagrams
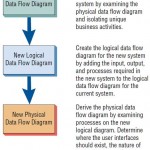
Data flow diagrams are categorized as either logical or physical. A logical data flow diagram focuses on the business and how the business operates. It is not concerned with how the system will be constructed. Instead, it describes the business … [Read more...] about Logical and Physical Data Flow Diagrams
Developing Physical Data Flow Diagrams
After you develop the logical model of the new system, you may use it to create a physical data flow diagram. The physical data flow diagram shows how the system will be constructed, and usually contains most, if not all, of the elements found in the … [Read more...] about Developing Physical Data Flow Diagrams
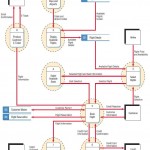
Partitioning Data Flow Diagrams
Partitioning is the process of examining a data flow diagram and determining how it should be divided into collections of manual procedures and collections of computer programs. Analyze each process to determine whether it should be a manual or … [Read more...] about Partitioning Data Flow Diagrams
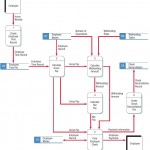
A Data Flow Diagram (DFD) Example
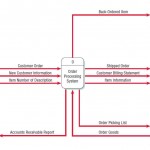
The following example is intended to illustrate the development of a data flow diagram by selectively looking at each of the components explored earlier in this chapter. This example, called "World’s Trend Catalog Division," will also be used to … [Read more...] about A Data Flow Diagram (DFD) Example
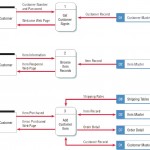
Partitioning Web Sites & Communicating Using DFDs
Partitioning is a very useful principle when designing a Web site. Web site designers who use forms to collect data may find it more appropriate to divide a Web site into a series of Web pages, which will improve the way humans use the site, the … [Read more...] about Partitioning Web Sites & Communicating Using DFDs