In computer graphics, there are three types of transformations: scaling, translation, and rotation:
- The scaling transformation changes the dimensions of a shape but not its basic form. If you scale an ellipse by 0.5, you’ll get another ellipse that’s half as wide and half as tall as the original one.
- The translation transformation moves a shape by a specified distance. If you translate a rectangle by 30 pixels along the x-axis and 90 pixels along the y-axis, the new origin will be 30 pixels to the right and 90 pixels down from the original rectangle’s top-left corner.
- The rotation transformation rotates a shape by a specified angle, expressed in degrees; 360 degrees correspond to a full rotation, and the shape appears the same. A rotation by 180 degrees is equivalent to flipping the shape vertically and horizontally.
Transformations are stored in a 5 × 5 matrix, but you need not set it up yourself. The Graphics object provides the ScaleTransform, TranslateTransform, and RotateTransform methods, and you can specify the transformation to be applied to the shape by calling one or more of these methods and passing the appropriate argument(s). The ScaleTransform method accepts as arguments scaling factors for the horizontal and vertical directions:
Graphics.ScaleTransformation(Sx, Sy)Code language: CSS (css)If an argument is smaller than one, the shape will be reduced in the corresponding direction; if it’s larger than one, the shape will be enlarged in the corresponding direction. We usually scale both directions by the same factor to retain the shape’s aspect ratio. If you scale a circle by different factors in the two dimensions, the result will be an ellipse, and not a smaller or larger circle. The TranslateTransform method accepts two arguments, which are the displacements along the horizontal and vertical directions:
Graphics.TranslateTransform(Tx, Ty)Code language: CSS (css)The Tx and Ty arguments are expressed in the coordinates of the current coordinate system. The shape is moved to the right by Tx units and down by Ty units. If one of the arguments is negative, the shape is moved in the opposite direction (to the left or up).
The RotateTransform method accepts a single argument, which is the angle of rotation expressed in degrees:
Graphics.RotateTransform(rotation)Code language: CSS (css)The rotation takes place about the origin. As you will see, the final position and orientation of a shape is different if two identical rotation and translation transformations are applied in a different order.
Every time you call one of these methods, the elements of the transformation matrix are set accordingly. All transformations are stored in this matrix, and they have a cumulative effect. If you specify two translation transformations, for example, the shape will be translated by the sum of the corresponding arguments in either direction. These two transformations:
Graphics.TranslateTransform(10, 40)
Graphics.TranslateTransform(20, 20)Code language: CSS (css)
are equivalent to the following one:
Graphics.TranslateTransform(30, 60)Code language: CSS (css)To start a new transformation after drawing some shapes on the Graphics object, call the Reset-Transform method, which clears the transformation matrix.
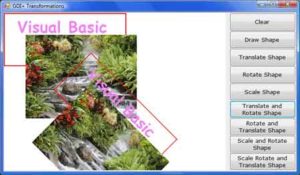
The effect of multiple transformations might be cumulative, but the order in which transformations are performed makes a big difference. You will find some real-world examples of transformations in Chapter where I discuss printing with Visual Basic. In specific, you’ll see how to apply transformations to print rotated strings on a page. Download the Transformations example project of this section. This project allows you to apply transformations to an entity that consists of a rectangle that contains a string and a small bitmap, as shown in Figure 14.16. Each button on the right performs a different transformation or combination of transformations. The code is quite short, and you can easily insert additional transformations or change their order, and see how the shape is transformed. Keep in mind that some transformations might bring the shape entirely outside the form. In this case, just apply a translation transformation in the opposite direction.

The code behind the Translate Shape, Rotate Shape, and Scale Shape buttons is shown in Listing 14.16. The code in the Click event handlers of the buttons sets the appropriate transformations and then calls the DrawShape() subroutine, passing the current Graphics object as an argument. The DrawShape() subroutine draws the same shape, but its actual output (the position and size of the shape) is affected by the transformation matrix in effect.
Listing 14.16: The Buttons of the GDIPlusTransformations Project
Private Sub bttnTranslate_Click(ByVal sender As System.Object, _
		ByVal e As System.EventArgs) Handles bttnTranslate.Click
	G.ResetTransform()
	G.TranslateTransform(200, 90)
	DrawShape(G)
End Sub

Private Sub bttnRotate_Click(ByVal sender As System.Object, _
		ByVal e As System.EventArgs) Handles bttnRotate.Click
	G.ResetTransform()
	G.RotateTransform(45)
	DrawShape(G)
End Sub

Private Sub bttnTranslateRotate_Click(ByVal sender As System.Object, _
		ByVal e As System.EventArgs) Handles bttnTranslateRotate.Click
	G.ResetTransform()
	G.TranslateTransform(200, 90)
	G.RotateTransform(45)
	DrawShape(G)
End SubCode language: CSS (css)
The ImageCube Project
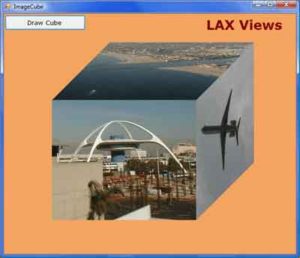
As discussed earlier in this chapter, the DrawImage method can render images on any parallelogram, not just a rectangle, with the necessary distortion. A way to look at these images is not as distorted images, but as perspective images. Looking at a printout from an unusual angle is equivalent to rendering an image within a parallelogram. Imagine a cube with a different image glued on each side. To display such a cube on your monitor, you must calculate the coordinates of the cube’s edges and then use these coordinates to define the parallelograms on which each image will be displayed. Figure 14.17 shows a cube with a different image on each side.
If you’re good at math, you can rotate a cube around its vertical and horizontal axes and then map the rotated cube on the drawing surface. You can even apply a perspective transformation, which will make the image look more like the rendering of a three-dimensional cube. This process is more involved than the topics discussed in this book. Instead of doing all the calculations, I came up with a set of coordinates for the parallelogram that represents each vertex (corner) of the cube. For a different orientation, you can draw a perspective view of a cube on paper and measure the coordinates of its vertices. After you define the parallelogram that corresponds to each visible side, you can draw an image on each face by using the DrawImage method. The DrawImage method will shear the image as necessary to fill the specified area. The result is a 3D-looking cube covered with images. You can open the sample project (Download here) and examine its code, which contains comments to help you understand how it works.

Plotting Functions project
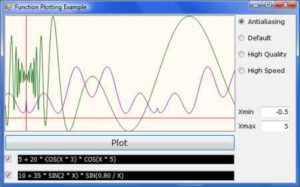
In this last section of this chapter, I address a fairly common task in scientific programming: the plotting of functions or user-supplied data sets. If you have no use for such an application, you can skip this section. I decided to include this application because many readers (especially college students) might use it as a starting point for developing a custom plotting application. A plot is a visual representation of a function’s values over a range of an independent variable. Figure 14.18 shows the following function plotted against time in the range from −0.5 to 5:
10 + 35 * Sin(2 * X) * Sin(0.80 / X)The plot of Figure 14.18 was created with the FunctionPlotting project. The variable x represents time and goes from −0.5 to 5. The time is mapped to the horizontal axis, and the vertical axis is the magnitude of the function. For each pixel along the horizontal axis, we calculate the value of the function and turn on the pixel that corresponds to the calculated value.

The application’s code is fairly lengthy. You can download the source code (download project) and examine the example.


